Market Port
It is time to descend into details. We will now define the interfaces that define our business logic's view on the world. That is, the ports it uses:
- Market port (this post).
- Trading port.
- Other strategy ports.
As we defined in the modules and components post, the aim of the market port is to abstract out all details of connecting to market data providers to receive real-time market events.
It is therefore time we detail what those events consist of and what they mean. In short, we need to describe the domain model the market port represents. Then, we will establish the features the port has to implement to represent it in a useful way.
Domain model
What is a market?
If you are familiar with financial markets, simply skip down to port features.
Wikipedia offers the following definition:
A market is one of the many varieties of systems, institutions, procedures, social relations and infrastructures whereby parties engage in exchange. […] It can be said that a market is the process by which the prices of goods and services are established.
Said otherwise, a market is where sellers and buyers meet. Organized markets, or exchanges, define the rules and provide tools to facilitate the transactions, most notably by gathering buyers and sellers intent and matching them.
- Market
In its stricter acceptation in finance, a market is a notional place where economical agents meet to trade two specific assets. For instance, the “Brent Crude market” allows trading oil from the North Sea against US dollar. An exchange typically offers dozens or hundreds of markets.
- Order
An order is an expression of the intent of a buyer or seller. They come in two variants:
- a limit order expresses the intent to buy or sell a specific amount at a defined price.
- a market order expresses the intent to buy or sell right now, at whatever best price is currently offered.
On top of that, the exchange may provide additional features, such as conditional triggers (known as stop loss orders) and follow-up orders.
- Match engine
The match engine is the technical system responsible for gathering orders and matching them according to exchange rules. Whenever a match is found, a transaction happens. That is, the matched orders fill each other, assets are transferred between buyer and seller's accounts, and the orders are removed from the system.
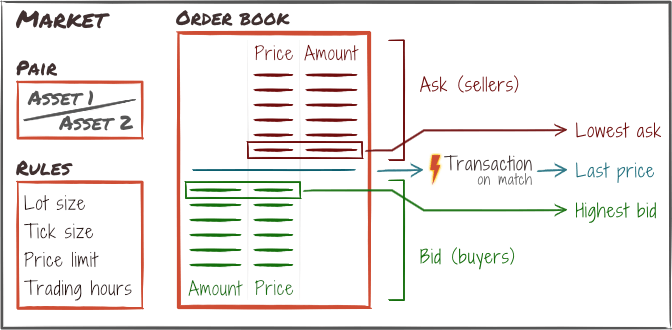
- Order book
The match engine organizes open orders into a list, known as the order book. It is split into a bid side (with buy orders) and an ask side (with sell orders).
The order book reflects the available liquidity on the market at any moment. This information is usually public, though some exchanges offer the possibility of concealing orders for a fee.
- Price
As there is no authority quoting the price, it fluctuates naturally according to orders and transactions. We typically use three different prices to fully define the concept:
- the highest bid is the price of the order at the top of the bid side in the order book. That is, the best price one can sell at right now.
- the lowest ask is the price of the order at the bottom of the ask side in the order book. That is, the best price one can buy at right now.
- the last price is the price the last transaction happened at. That is, the last time a buyer and a seller agreed on a price.
- Tick
A tick represents the change of price from trade to trade. It is therefore a real-time view of buyers and sellers consensus on price, and the most fundamental movement in the market. On very active markets, there may be several thousands of ticks per second.
Ticks are the initial event Cryptomate has to respond to.
With time, many people devised ways to visualize and interpret market data, aiming at anticipating future evolution for profit.
Market analysis and price
Technical analysis is a discipline that studies past market data, in an attempt to forecast the direction of price. Without going into the details of this field, we will highlight information that matters to Cryptomate.
As price moves quickly, visualization systems were developed to build a more usable representation of its evolution over time. The most ubiquitous is the candlestick chart. It synthesizes price moves over homogeneous time slices of configurable duration.
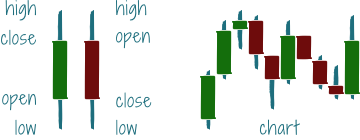
An alternate representation of the same data is bar-charts, that replace the shadow/body visual with tiny markers.
While this model is not the only one, it is the one normally used to store and communicate price history. Also, since it was prevalent for much of modern financial history, a lot of tools use that model to derive additional insight. For instance, the vast majority of indicators (discrete mathematical formulas and algorithms to identify patterns) rely on this aggregated data.
On the other hand, with tick data being increasingly available, and algorithmic trading making it possible to interpret tick stream in a meaningful way, newer indicators are now developing, that work directly with raw ticks in an attempt to get a more accurate picture.
The market port must therefore support both data streams, in order to build on the large amount of work done on classical indicators, while leveraging the newer tick based ones.
Market port features
Having described the events and data the market port has to make available, we can design it accordingly, revolving around two major themes:
- Managing dynamic subscriptions to market event feeds.
- Processing events into meaningful structures.
Workflow
The aim of the market port is to abstract out all details of connecting to the market providers and handling the real-time feeds. Using it should thus be as simple as handing it a feed description and a callback, getting an active subscription in return :
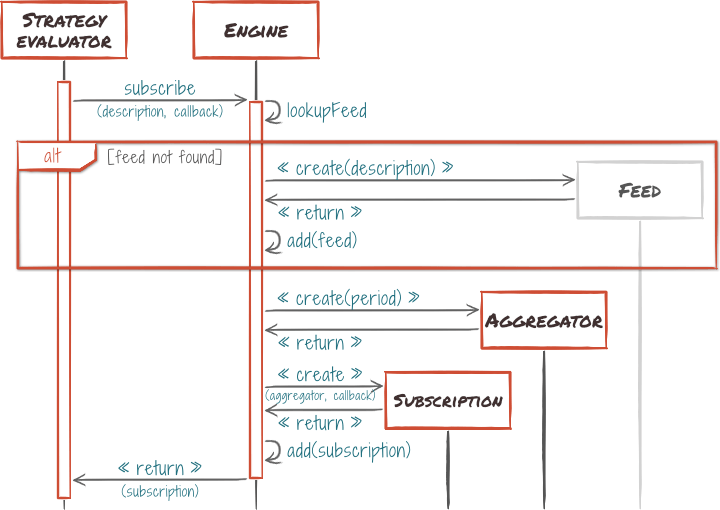
The actual process will be a bit more complex, as the market engine will populate aggregators with past data from a history adapter, if it has one.
Returned subscription should then be stored by the calling code, subsequently used to access aggregated data and, eventually, cancel the subscription.
While the subscription is active, every update received from the market data feed generates an event, which is delivered to the supplied callback synchronously :
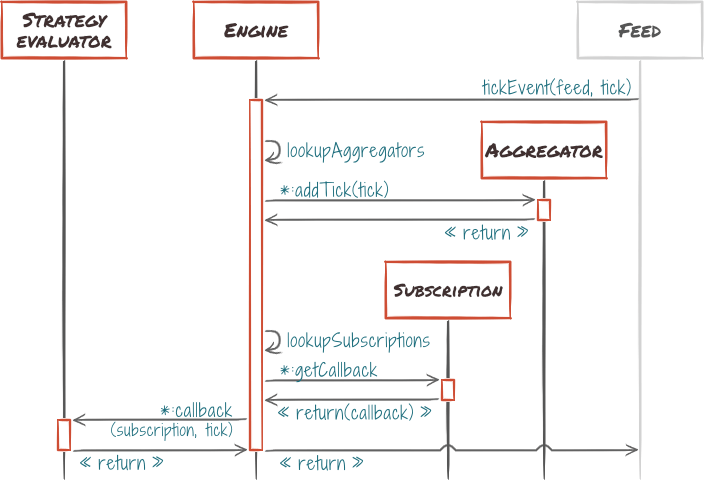
As event delivery is synchronous, the client object is responsible for choosing whether to process events on the fly, or queue them for processing later, possibly in another thread.
Finally, order book events shall work in the same way, except the aggregator is replaced with an order book view, aggregating order updates into a full view of current order book.
Interface list
Assembling the features and objects described in previous sections, here is the full list of interfaces that, together, constitute the market port:
| Name | Description |
|---|---|
Aggregator |
Aggregated candle data over a configurable time period. |
Candle |
Aggregated tick data, forming a single candle. |
Engine |
Main port entry point. |
FeedDescription |
Static data identifying a market on a provider and aggregation settings. |
Tick |
Single tick data. |
TickEventHandler |
Callable that responds to tick events, provided by client code. |
TickSubscription |
Represents a subscription to tick events. |
OrderBook |
Instant representation of the order book. |
OrderBookSubscription |
Represents a subscription to order book events. |
OrderBookEventHandler |
Callable that responds to order book events, provided by client code. |
For detailed specification of each interface, check their definition and inline documentation on GitHub. Note that due to the dynamic nature of python, not all interfaces need to appear as python types within the code.
Conclusion
That is it for the market port. You will find the result on GitHub under the market
directory. In the next post, we will turn to the trading port.